





Know What Will Sell, and Who Will Stop Buying
Our predictive analytics forecasts demand and sales from your own history and flags customers likely to stop buying. Every forecast is tested on a past period before your team relies on it.
 WhatsApp


Why your plans still rest on last year's spreadsheet
Your systems already hold the history of your orders, customers and sales. Most teams still plan from a spreadsheet and a hunch, so stock runs out, customers drift away unnoticed, and targets are guesses.
-
“We only notice a customer has gone when they have already gone.”

Each customer is judged against its own ordering habit, so your team hears early when one goes quiet.
-
“We either run out of stock or sit on too much of it.”

A demand forecast for each product shows what to reorder, and when, from your own sales history.
-
“Our sales forecast is whatever the team hopes for.”

A forecast built from past sales and seasons, with a range, so plans start from your data.

Answers for what to reorder and who to call
These forecasts and signals help with decisions your team makes every week. Where we have done related work for a client, the item links to it.
-
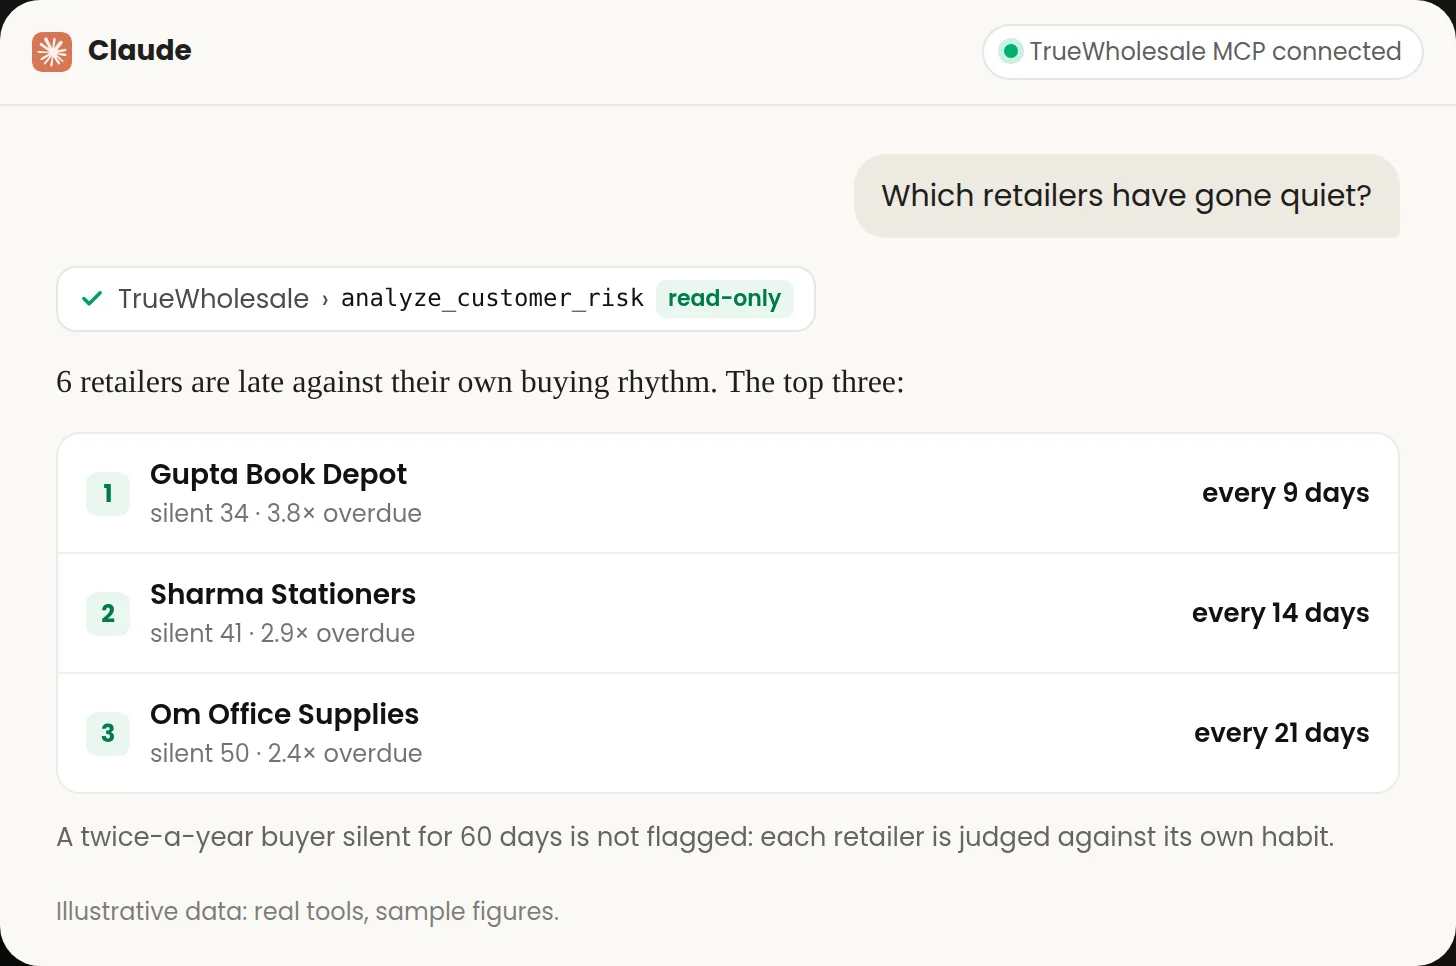
Customers who have gone quiet
At TrueWholesale, a read-only tool judges each retailer against its own buying habit, so a twice-a-year buyer is not flagged for a quiet spell.
TrueWholesale customer risk tool -
Churn prediction
A model that flags customers likely to stop buying, so your team can act first. The ProvisCommerce build includes a churn service.
ProvisCommerce case study -
Stock and reorder signals
Which products will run out before new stock arrives, so you reorder in time. At TrueWholesale, a read-only tool answers that question today.
TrueWholesale replenishment tool -
Sales forecasting
Next quarter's sales by product, region or team, built from past sales and seasons, with a range of likely outcomes.
-
Forecasts inside your tools
Forecasts appear in the dashboard, stock and accounts system (ERP) or customer system (CRM) your team already opens, and refresh as new data arrives.
Need answers about what has already happened? See conversational BI (asking your business data questions in plain English)
A forecast you can check against your own past
You get a working forecast on your own data, with back-tests that show how it would have done on your past. A written note of the signals it uses and instructions for your team come with it.
-

A forecast on your data
Demand, sales or churn, from the history in your systems.
-

A signal list you sign off
What the model uses, what it leaves out, and why.
-

Back-tests on your history
How the forecast would have done on past periods, rerun as data grows.
-

Read-only access to your data
The model reads your systems and writes nothing back unless you ask.
-

Forecasts where your team works
In the dashboard or system your team already uses, with the reasons behind each one.
-

Instructions and a handover for your team
The code in your own code repository, the documentation and a walkthrough.
Pilot-first
A first pilot: one forecast, tested on your own history
Pilot-first: we start with a small pilot on your own data, priced up front, before any full build. We pick one forecast, such as demand or churn, build it from your past data, and test it on a period the model has not seen.
- What the pilot builds
- One forecast on your own data, with the signals it uses written down and a back-test on your history.
- What you get
- How well it would have predicted your own past, and a clear view of what a full build would take.
How predictive analytics works
Predictive analytics uses your own history to estimate what comes next. A model learns patterns from past data, such as seasons and each customer's order rhythm, and gives a forecast with a range. We test it on past results before your team relies on it.
-
Request
Your team needs a forecast for a decision it makes again and again.
-
History
The model learns from your past orders, customers and sales.
-
Back-test
It is tested on past periods it has not seen.
-
Your data
It reads your systems, read-only, as new data arrives.
-
Forecast
Your team gets the forecast, its range and the reasons behind it.
- Request “Which customers may stop buying from us soon?”
- History The model reads each customer's past orders and their usual rhythm.
-
Your data
Reads each customer's order dates, order values and the gaps between orders. -
Your data
Scores how likely each customer is to stop buying, with the reasons behind it. - Forecast A ranked list of customers at risk, each with why, for your team to call.
The model suggests. Your team decides who to contact and what to offer.
Forecasts tested on your history and looked after once live
We build forecasts on the systems you already run, test them on your own history, and stay after launch, because a forecast needs looking after as your data changes.
 View our work
-
Signals from real ordering data
TrueWholesale's team sees which retailers are late against their own buying rhythm.
-
Built around your systems
We read the history in the store, ERP, CRM or database you already run, and send forecasts back to the tools your team opens.
-
Support after launch
We monitor the model after launch, keep it updated and retrain it as your data changes.
-
Hours that overlap yours
We work on India Standard Time (IST): 4.5 to 5.5 hours ahead of London and 9.5 to 10.5 ahead of New York.
A forecast your team knows how far to trust
We test each forecast on your past, show its range, and keep people in charge of what to do with it. These are the safeguards on every model we build.
On every forecasting model we build
- Back-tested on your own history before launch, and retested as new data arrives.
- Every forecast shows its range, so nobody mistakes it for a certainty.
- Read-only access to your data, with changes written back only when you ask.
- Personal details left out wherever the forecast does not need them.
One forecast for one decision, then more as it proves out
We start with one forecast, test it on your own history, and add more once the first has proved itself. Each step is priced up front.

The tools we build forecasting models with
Standard, widely used tools, so another team could take the code over. We choose the model per question, on accuracy, how much history you have and how easy it is to explain, and build in your own cloud account.
-
Models
Forecasting and churn models in Python, chosen per question.
- Python
-
Service
Python and FastAPI for the forecasting service, as in the ProvisCommerce churn service.
- FastAPI
-
Explaining
OpenAI and Anthropic Claude to put a forecast and its reasons in plain English, or open models on Ollama when data has to stay on your servers.
-
 Anthropic Claude
-
 OpenAI
-
 Ollama
-
-
Data and hosting
PostgreSQL for history and forecasts, in your own cloud account, such as AWS.
-
 PostgreSQL
- AWS
-
-
Your systems
Your store, ERP, CRM or database, where the history lives and the forecasts are used.
Provis Technologies AI Integration services are phenomenal. We have been witnessing growth after the AI automation they have put into our business.

Bring us one decision you would like to forecast.
Tell us what you reorder, plan or chase each week, and where your history lives. We will show you which forecast we would build first, and how we would test it.





Vivek SharmaCEO & Founder, Provis Technologies
Questions about predictive analytics
What is predictive analytics?

It uses your own history to estimate what comes next, such as demand for each product, next quarter's sales or which customers may stop buying. A model learns patterns from past data and gives a forecast with a range, so your team can plan from evidence.
How is it different from a BI dashboard or conversational BI?
A business intelligence (BI) dashboard, or a chat that answers questions about your data, tells you what has already happened. Predictive analytics estimates what will happen next. They work well together: the forecast can appear in the same dashboard your team already uses.
How much data do we need?
Enough history to show the pattern you want to predict, such as several seasons of sales or many customers who stayed and left. We check what you hold in the data review, and tell you plainly if it is too thin before you pay for a build.
How accurate will the forecast be?
We cannot say until we test it on your data, so we back-test it on past periods the model has not seen, checking its forecasts against what really happened. You see how it would have done, and every forecast shows its range. No forecast is certain, and we never present one as if it were.
What does demand forecasting involve?
A model learns how much of each product sells, and when, from your sales history and seasons. Combined with your stock and supplier lead times, it shows what to reorder before it runs out.
How does churn prediction work?
A model compares each customer's recent behaviour with their own past, such as how often they usually order, and flags the ones drifting away.
Can you forecast sales for our team?
Yes. We build sales forecasts by product, region or team from your past sales, seasons and, where you track it, your pipeline. Each forecast comes with a range, so targets start from your own data.
Does it work with our existing systems?
Yes. We read the history from the store, ERP, CRM or database you already run, read-only, and send forecasts back to the tools your team opens. We connect AI to the tools you have instead of replacing them.
Is our data kept private?
Yes. The model runs in your own cloud account, and we leave personal details out wherever a forecast does not need them. If a language model (the kind of AI behind ChatGPT and Claude) explains a forecast, hosted models from OpenAI or Anthropic process what is sent; open models on Ollama keep it inside your network.
How much does a forecasting model cost?
Three things drive the cost: how many forecasts you need, how scattered your data is, and where the forecasts must appear. Tell us the decision you want to improve, and within two working days we come back with an approach, a rough timeline and a rough number.
How long does it take to build?
It depends on the data and the forecast. We start with one forecast in a pilot, so you see its back-test on your own history before a full build. We agree the timeline at the discovery call.
Who owns the model and the code?
You do. The code and the trained model go into your own code repository, and the cloud account and the data are in your company's name. Our team joins as collaborators, and you can remove our access at any time.
What happens after launch?
We monitor accuracy, retrain the model as your data grows, and keep it updated. Patterns change, with new products, prices or customers, so we keep retesting the forecast on new data.

Work with experts
Built for teams that want to plan from their own data
We build forecasts and churn models on your own data, tested on your history before your team relies on them.
Prefer to talk directly?
-
 Emailsales@provistechnologies.com
-
 WhatsApp+91 88755 82124
-
 UK phone+44 7862 126522
-
 Video callBook 30 minutes with Vivek Sharma
We're on IST: 4.5 to 5.5 hours ahead of London, 9.5 to 10.5 ahead of New York.
-
1
 The forecast
-
2
Your details
-
3
Additional info
Tell us what you want to forecast
Describe the decision you want to improve, the data you hold, and where the forecast should appear.
Prefer to talk directly?
-
Emailsales@provistechnologies.com
-
WhatsApp+91 88755 82124
-
UK phone+44 7862 126522
-
Video callBook 30 minutes with Vivek Sharma
We're on IST: 4.5 to 5.5 hours ahead of London, 9.5 to 10.5 ahead of New York.